1000 Sharpe Ratio  1000 Total Return [%]  1000 Alpha  500 Sharpe Ratio  500 Total Return [%]   500 Alpha  0 Sharpe Ratio  0 Total Return [%]    0 Alpha  1000 Beta  500 Beta    0 Beta
(LII, ZBRA)           1.611765               0.713498    0.122776          5.045619              2.339839    0.451484        6.113495            4.683680   1.352321   0.537455 -1.310287
Total Return [%] > 0, Sharpe Ratio > 1, and
Alpha > 1.
stock_list = ['A',...]
    import yfinance
    df_hr = yfinance.download(stock_list,period='max',interval='1h')['Close']
NA for more than 10 data points stocks_not = (df_hr.isna().sum() > 10)
stocks_not_sym = stocks_not[stocks_not].index
df_hr = df_hr.drop(columns=stocks_not_sym) df_hr.to_parquet('Close_h.parquet')runner_multiple for separating the time periods,
runner to implement parallelism, coint_filter to execute the
cointegration filter.
def runner(stock_pair, shift_parameter:int, filter_func,inputs=None,outputs=None,*args):

    parameters = args

    if inputs:

        args = stock_pair[[x for x in stock_pair.columns if (str(shift_parameter) + inputs[0]) == x]]
        args = args.squeeze(1)
        args.index = [tuple(x) for x in args.index]

        p_list = [[x[0],x[1],shift_parameter,args[x]] + list(parameters) for x in stock_pair.index]

    else:
        p_list = [[x[0], x[1], shift_parameter] + list(parameters) for x in stock_pair.index]

    with Pool(processes=15) as pool:
        filter_results = pool.map(filter_func, p_list)
    filter_results = np.array(filter_results)
    col = outputs

    val = [str(shift_parameter) +  ' '  + col[x] for x in range(len(col))]

    series_coint = pd.DataFrame(index=stock_pair.index,data= filter_results,columns=val)
    series_coint = series_coint[series_coint != 0].dropna(axis=0)

    return pd.concat([series_coint,stock_pair],axis=1,join='outer').dropna()

def runner_multiple(stock_pair_list, shift_parameter_list, filter_func, *args):
    inner = [' correlation']
    outer = ['Sharpe Ratio','Total Return [%]','Alpha']

    if len(shift_parameter_list) == 1:
        return runner(stock_pair_list, shift_parameter_list[0], filter_func, inner, outer,*args)
    return runner_multiple(runner(stock_pair_list, shift_parameter_list[0], filter_func,inner,outer,*args),shift_parameter_list[1:],
                           filter_func,*args)

def cointegration_filter(cur_stock):

    cur_pair=get_time_period(list(cur_stock[0:2]), custom_data=True, num_data_points=500,shift=int(cur_stock[2])+1)

    model = m.OLS(cur_pair[cur_stock[0]], m.add_constant(cur_pair[cur_stock[1]])).fit()
    resudials = model.resid
    adf_result = adfuller(resudials)
    arr = np.zeros(2)
    if adf_result[1] < .050000 + .0000000001:

        arr = np.array([model.params.iloc[1],adf_result[1]])
    return arr
def run():
    full_data = pd.read_parquet('Close_h.parquet')
    shape =full_data().shape
    full_stock_list = pd.read_parquet('Data/Prices/C_h_max.parquet').columns
    b_test_size = 500
    parameters = [x * b_test_size for x in list(range(int(shape[0]/b_test_size) - 1))]

    outer = ['Beta','P']
    stock_pair = [(x,full_stock_list[y]) for x in full_stock_list for y in range(list(full_stock_list).index(x) + 1,len(full_stock_list) )]
    inner = None

    runner_multiple(pd.DataFrame(index=stock_pair),parameters,cointegration_filter,inner,outer,'h').to_parquet('Coint_h_.parquet')
              1000 Beta    1000 P  500 Beta     500 P    0 Beta       0 P
[AIG, FTNT]   -0.083102  0.047680 -0.284665  0.017259  0.257739  0.039461
[AME, XYL]     0.726617  0.046429 -0.533354  0.034288  0.579746  0.006538
[APO, HWM]    -0.411172  0.015298  0.097011  0.006966  1.199704  0.000872
[BDX, CAH]     0.135149  0.046288  0.214275  0.048949 -0.384267  0.000344
[BDX, CBRE]    0.060702  0.049266  0.379405  0.015167  0.055965  0.000334
[BDX, CDNS]   -0.121985  0.015403  0.262596  0.024705 -0.044974  0.005623
[BDX, CPRT]   -0.154714  0.046403  0.181982  0.048639 -0.264519  0.006679
[BDX, DHI]     0.063386  0.047875  0.363210  0.040529  0.011405  0.000897
[BDX, EIX]     0.125288  0.042882 -0.195688  0.035605  0.039419  0.000868
[BDX, EW]     -0.058409  0.018648  0.309808  0.046106  0.047884  0.000379
[BDX, HLT]    -0.195437  0.041674  0.565638  0.005037 -0.008447  0.007146
[BDX, LIN]     0.294134  0.046631  0.331551  0.041965 -0.043177  0.004620
[BDX, MAR]    -0.158159  0.030317  0.475997  0.039473  0.000157  0.001231
[BDX, MGM]    -0.103435  0.011550  0.310071  0.025108  0.070420  0.000277
[BDX, ORLY]    0.125403  0.046683  0.251336  0.038608 -0.091899  0.001540
[BDX, PTC]    -0.264898  0.020838  0.455175  0.018323  0.002720  0.001169
[BDX, SNA]     0.379158  0.038147  0.342321  0.021637 -0.088651  0.001608
[BDX, SWK]     0.107498  0.041371  0.388762  0.012328 -0.007670  0.001304
[BDX, WY]      0.253453  0.037636  0.254308  0.031156  0.121255  0.000231
[BR, JNJ]      0.555380  0.032972  0.369620  0.016312  1.497904  0.038210
[BR, LH]       0.473417  0.034636  0.366693  0.005316  1.372902  0.007034
[CAH, KDP]     1.362023  0.049249 -0.883024  0.027570 -0.161966  0.018422
[CARR, ESS]    1.205232  0.011339  1.431153  0.018837  0.586101  0.004010
[CZR, IBKR]    0.537455  0.007325 -1.310287  0.046855 -0.222065  0.034051
[CZR, KDP]    -0.139386  0.030781 -1.180052  0.042852  1.208031  0.018901
[CZR, ORLY]   -0.092348  0.025337  1.434448  0.045476 -0.490495  0.034259
[CZR, PCG]    -0.139136  0.031334 -1.552383  0.047963  0.672767  0.035189
[CZR, ROK]     0.661486  0.046493  2.302104  0.033505  0.351829  0.039953
[D, DGX]       1.207393  0.025756  1.035669  0.000387  0.652909  0.008598
[D, PM]        0.663087  0.008645  1.025006  0.035694  1.053789  0.045147
[DLR, MPC]    -0.516878  0.001527 -0.099889  0.006386  0.502615  0.040538
[ELV, SYK]     0.354081  0.020848 -0.687293  0.025601  0.384177  0.028553
[HUBB, VLO]   -0.218121  0.002736  0.451207  0.026030  1.226155  0.038493
[ISRG, REGN]   0.892592  0.008572  0.553883  0.006981  1.363003  0.017960
[KMI, NI]      0.489898  0.017513  1.013257  0.023299  1.071053  0.008799
[LII, REGN]    0.661044  0.023640  0.426604  0.027499  0.447949  0.031363
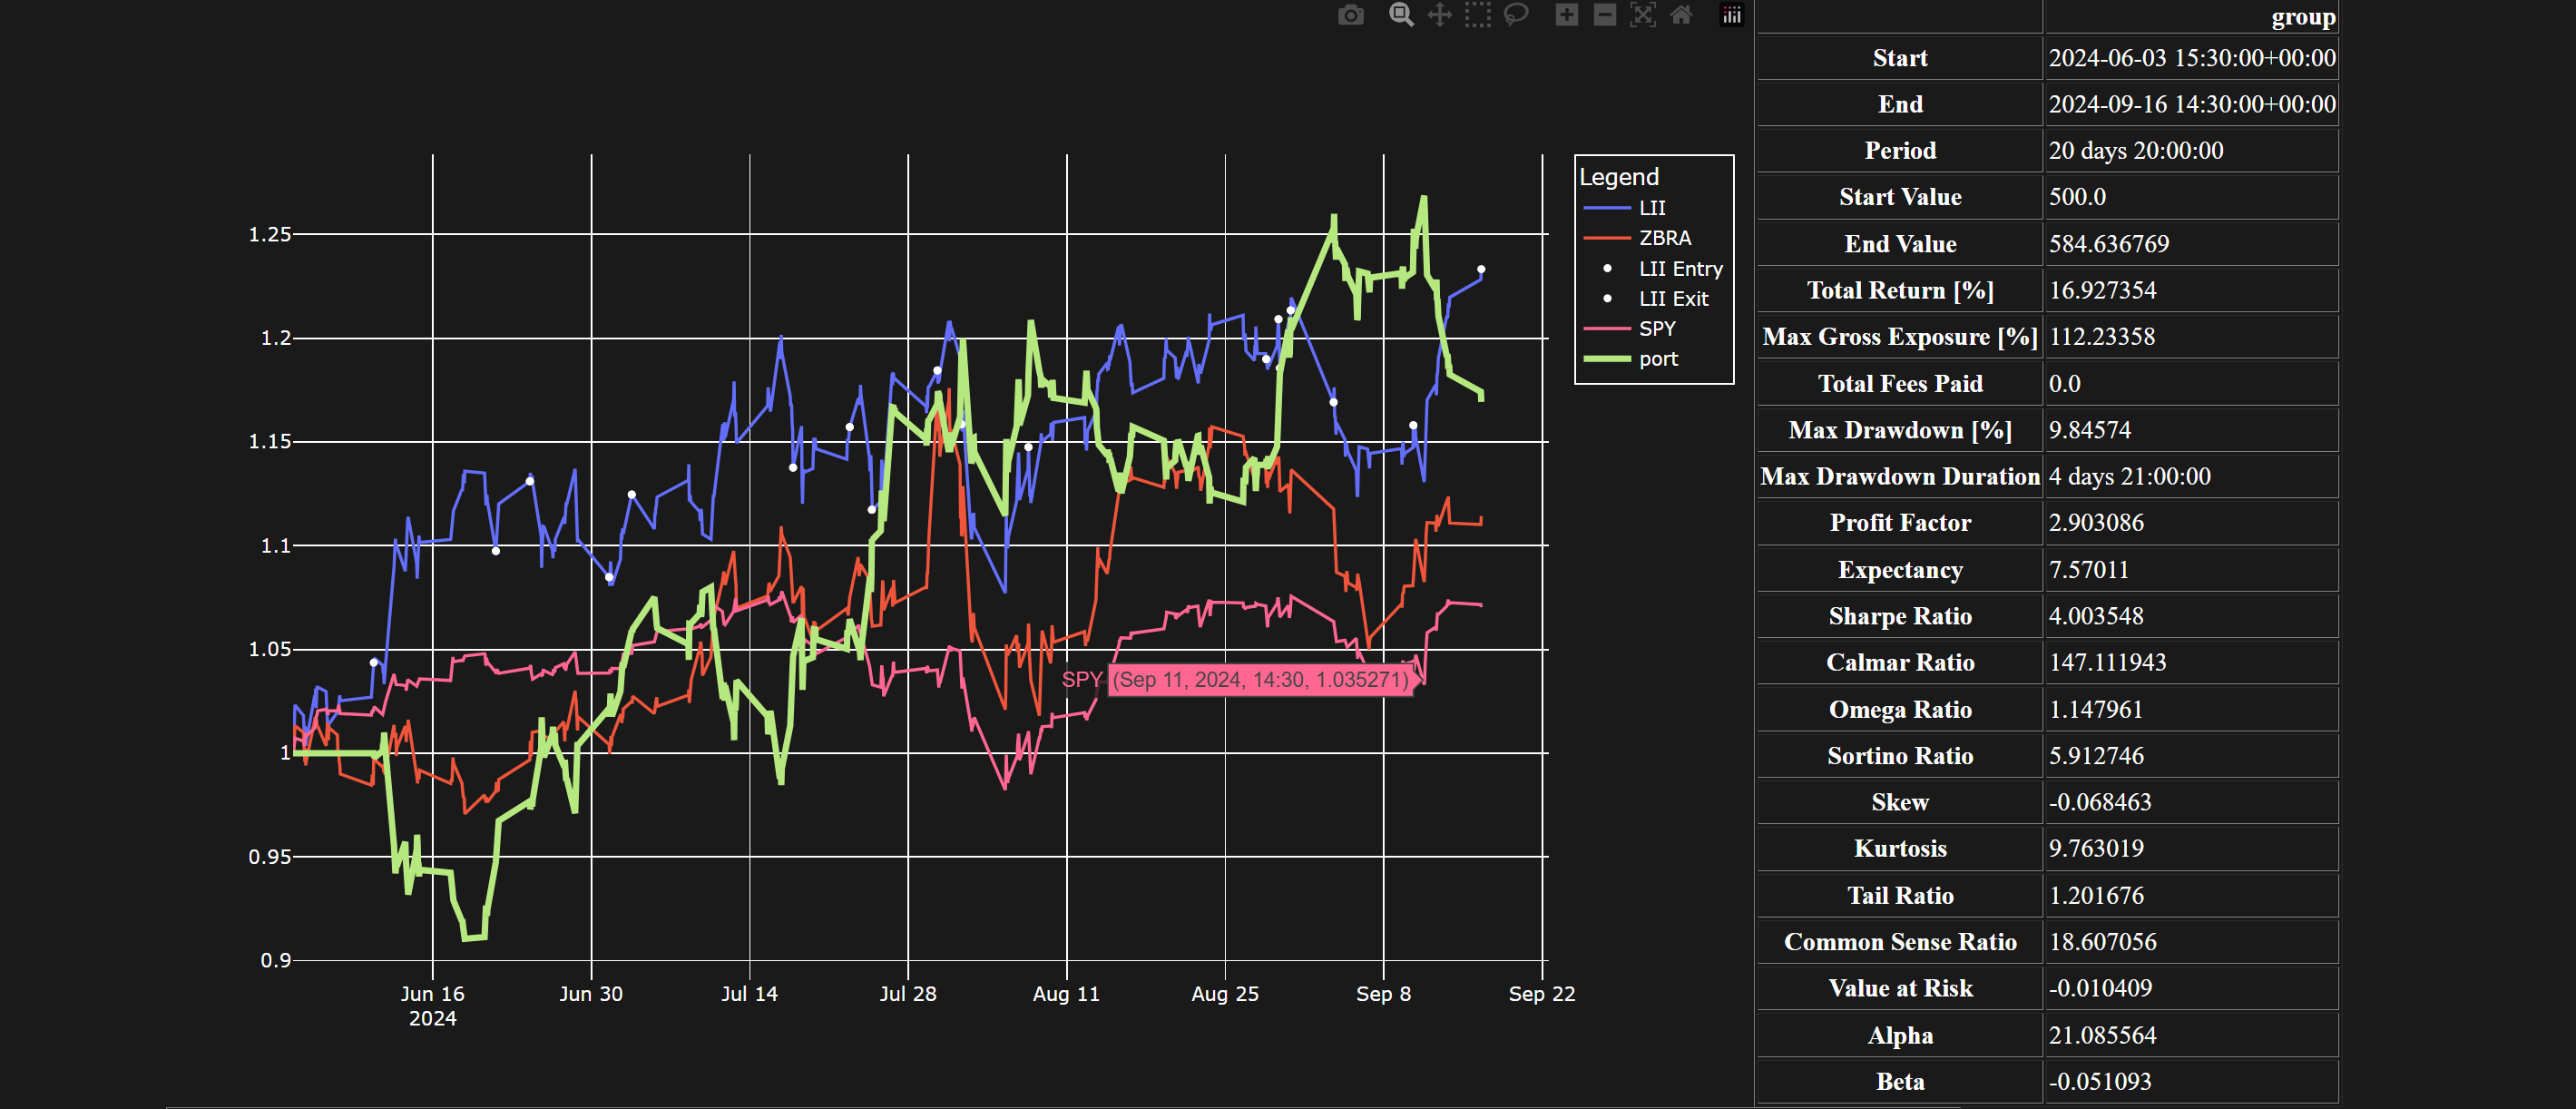
[LII, ZBRA]    0.759033  0.029653  0.325289  0.040034  0.461861  0.005646
total_return_percentage >
0, Sharpe > 1.0, and the number of completed trades > 30 are used to filter the results.
def objective(trial:optuna.trial.Trial):

    shape = pd.read_parquet('Data/Prices/C_h_max.parquet').shape
    b_test_size = 500
    parameters = [x * b_test_size for x in list(range(int(shape[0]/b_test_size) - 1))][0:5]

    arr = pd.read_parquet('coint.parquet')

    arr.index = [tuple(x) for x in arr.index]
    arr = arr[[x for x in arr.columns if 'Beta' in x]]
    inner = [' Beta']
    outer = ['Sharpe Ratio','Total Return [%]','Alpha']

    z_threshold = trial.suggest_float('z_threshold', 1.2, 1.9)
    roll = trial.suggest_int('roll',20,50,step=5)
    results = runner_multiple(arr, [0,500,1000], port_sim,inner,outer,'h',z_threshold, roll, )
    results = results[[x for x in list(results.columns) if 'Total Return' in x]].mean(axis=1).sum()

    return results
The results (only a sample is shown)
Total Return  params_roll  params_z_threshold
3  58.262771           45            1.140969
0  56.390493           45            1.199639
4  54.469744           35            1.251505
5  54.280807           50            1.161072
1  53.661921           40            1.235526
7  53.661921           40            1.232752
8  53.094989           50            1.269552
9  52.923594           50            1.294377
6  52.495792           50            1.287840
2  45.287221           40            1.182545
1000 Sharpe Ratio  1000 Total Return [%]  1000 Alpha  500 Sharpe Ratio  500 Total Return [%]   500 Alpha  0 Sharpe Ratio  0 Total Return [%]    0 Alpha  1000 Beta  500 Beta    0 Beta
(LII, ZBRA)           1.611765               0.713498    0.122776          5.045619              2.339839    0.451484        6.113495            4.683680   1.352321   0.537455 -1.310287 -0.222065
(CZR, ROK)            2.975080               3.481201    0.872476          9.472084              4.546082    1.236299        2.131693            0.856918   0.109566  -0.139386 -1.180052  1.208031
(ELV, SYK)            3.536863               3.126990    0.742342          9.563635              4.451920    1.221365        2.146127            0.856840   0.090308  -0.139136 -1.552383  0.672767
(CZR, KDP)            1.684640               2.946003    1.039572          6.384076             11.039806    4.882317        7.506912           24.010073  48.755809   0.661486  2.302104  0.351829
(CZR, PCG)            1.354914               4.814620    4.674047          3.403989             11.006988    8.085121        1.759185            5.525991   2.749191   0.354081 -0.687293  0.384177
(CZR, IBKR)           4.283332               1.136713    0.226230          2.326260              0.282280    0.051063        4.817141            0.475679   0.086839   0.489898  1.013257  1.071053
(KMI, NI)             5.627234              22.327100   41.515242          3.737291             23.853729  124.276119        1.258513            3.845521   1.555360   0.759033  0.325289  0.461861